

AT- A Glance
- The S&P 500 skyrocketed 9.5% in reaction to President Trump’s announcement to put a 90-day pause on his reciprocal tariffs with most countries, with the notable exception of China, where a back-and-forth trade war continues to escalate. According to FactSet, the one-day gain ranks as the third biggest since World War II for the stock market benchmark
- .Markets hate uncertainty. The level of the new tariffs and the manner in which they were being calculated, communicated, and implemented has created significant uncertainty around global trade and their potential impact on future corporate earnings.
- We should also remember that the current administration's other policy priorities could be more positive for the economy and global markets. These would include extending the existing tax cuts and deregulation.
- This has made the Federal Reserve Bank's job much more difficult, as it has created more uncertainty about the future path of both the Fed's mandates, inflation and unemployment.
- Luckily for people who are still in the accumulation phase of life and regularly deposit money into savings vehicles such as their 401(k)s, the decline in stock prices allows them to buy more shares of what they were already purchasing at a lower price.
- While it is perfectly understandable for market volatility to create fear and anxiety in the short term, it is essential to remember that your financial plan is designed to create success for you over the coming decades. Adjustments to your portfolio should be made in conjunction with your goals and objectives, not in response to day-to-day headlines.
The Investment Committee met on the afternoon of Wednesday, April 9th, as the S&P 500 had just skyrocketed 9.5% in reaction to President Trump’s announcement to put a 90-day pause on his reciprocal tariffs with most countries, with the notable exception of China, where a back-and-forth trade war continues to escalate. According to FactSet, the one-day gain ranks as the third biggest since World War II for the stock market benchmark, as shown in our first chart below. As the futures market had been down substantially early in the day, the actual bottom-to-close-of-day top is substantial on a percentage basis. Over 30 billion shares traded that day – the heaviest volume day in the history of Wall Street.
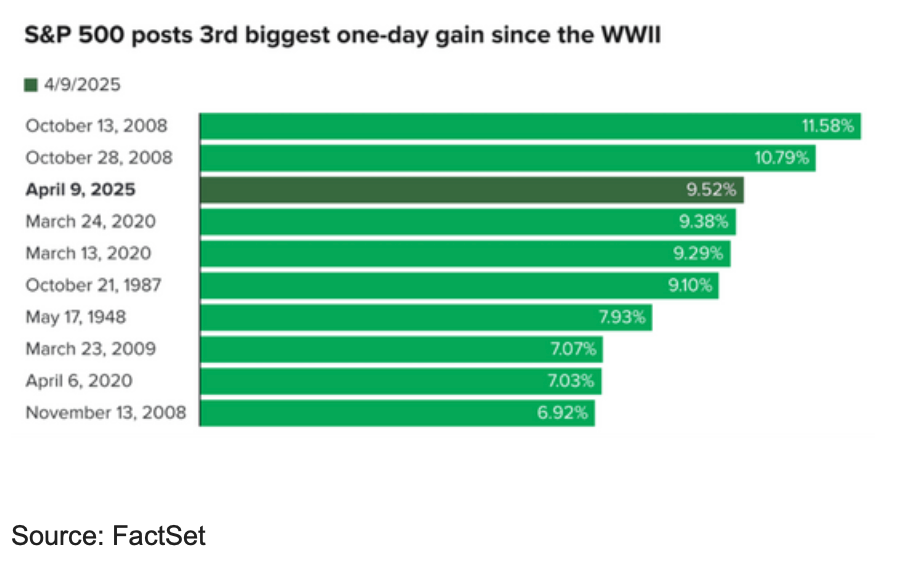
The market was extremely oversold on a technical basis and due for a rebound after a stretch of negative trading days. Over the previous four trading sessions, the S&P 500 suffered a 12% loss, a decline not seen since the pandemic. Heading into this morning's trading, the S&P 500 index was down more than 15%, while both the NASDAQ and Russell 2000 indexes were off more than 20%, on a year-to-date basis, moving them into bear market territory. You will likely notice in the chart above that many of the best days for the stock market in the last 80 years occurred alongside some of the worst days during times such as the stock market crash of 1987, the great financial crisis of 2008-2009, and the more recent COVID-19 economic downturns and market downturns.
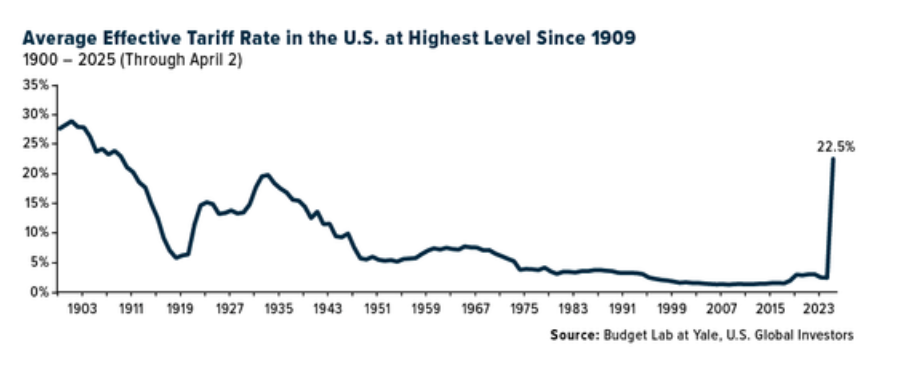
Markets hate uncertainty. The level of the new tariffs and the manner in which they were being calculated, communicated, and implemented had created significant uncertainty around global trade and their potential impact on future corporate earnings. As you can see in our second chart below, the average effective tariff rate in the United States is estimated to be at the highest level since 1909. Analysis from the Budget Lab at Yale University shows rates have moved from low single digits to higher levels than we saw in the aftermath of the Smoot-Hawley Tariff Act of 1930, which many believe exacerbated the downturn during the Great Depression. It is important to remember that just as one Rose Garden announcement sent global stock markets reeling, a second announcement trumpeting a 90-day pause sent markets significantly higher. This most recent announcement has not let us out of the woods, and future headlines could be met with similar bouts of volatility, both on the upside and the downside.
We should also remember that the current administration's other policy priorities could be more positive for the economy and global markets. These would include extending the existing tax cuts and adding additional tax relief for individuals and corporations. Beyond this, markets had previously been hopeful that deregulation, along with curbing government spending and reducing the annual budget deficit, could all be constructive in the future.
All this has made the Federal Reserve Bank's job much more difficult, as it has created more uncertainty about the future path of both the Fed's mandates, inflation and unemployment. There had been widespread speculation that tariff policies could slow economic growth, which could cause unemployment to rise while at the same time creating more inflation pressures due to one-time price increases. Luckily, this has not shown up in the economic data so far. The March jobs report released on Friday, April 4th, showed that the unemployment rate rose slightly to 4.2%, while the economy added 228,000 jobs in March, exceeding expectations. The unemployment rate increased due to positive factors such as more workers entering the labor market.
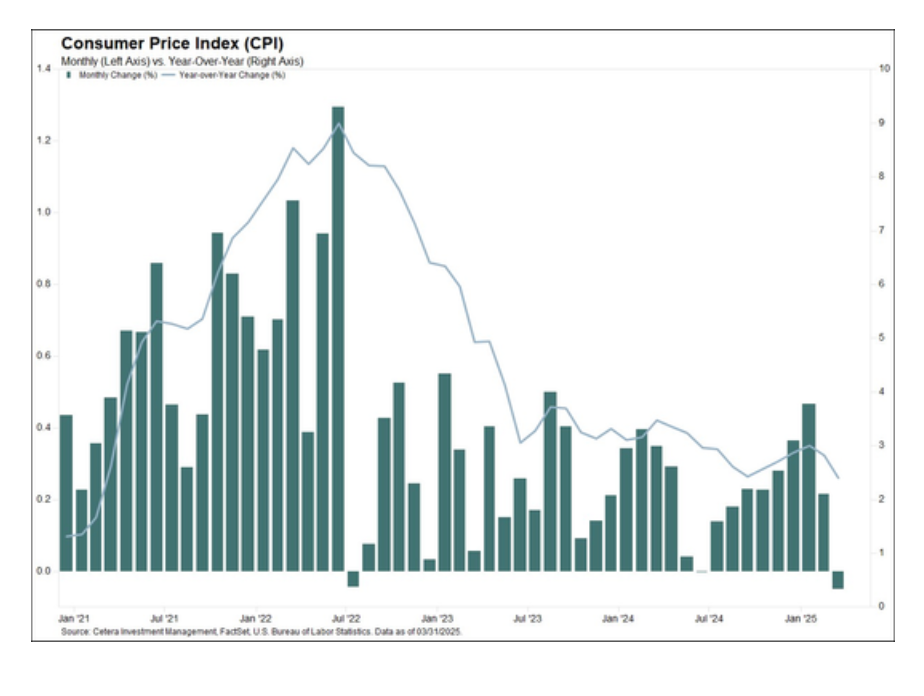
The morning after our meeting, the Fed got some additional good news on inflation as price pressures eased in March. Headline CPI fell 0.1% M/M (vs +0.1% expected), bringing annual inflation down to 2.4%. Core CPI rose 0.1% M/M (vs +0.3% expected), and the annual pace slowed to a 4-year low of 2.8%, as shown in our final chart below. This gives the Federal Reserve Bank more room to cut rates if or when needed to help shore up the economic growth.
Final Thoughts
Luckily for people who are still in the accumulation phase of life and regularly deposit money into savings vehicles such as their 401(k)s, the decline in stock prices allows them to buy more shares of what they were already purchasing at a lower price. Instead of being concerned about a temporary drop in their account balances, investors should focus on how many shares they can buy while things are "on sale." Warren Buffett is fond of saying Americans love to buy everything they can on sale except for their financial assets.
While it is perfectly understandable for market volatility to create fear and anxiety in the short term, it is essential to remember that your financial plan is designed to create success for you over the coming decades. We believe that adjustments to your portfolio should be made in conjunction with your goals and objectives, not in response to day-to-day headlines. Should you have questions about your situation, please contact your advisor. We are here to help guide you through times such as this toward a brighter and more confident financial future.
Should you have any questions regarding these notes, please do not hesitate to contact Kevin at (678) 401-6102.
Investment Committee Members
Kevin Myers, Financial Advisor - ATL Global Advisors
Jesse Hurst, Financial Advisor - Chair, Impel Wealth Management
Clint Gautreau, Financial Advisor - Horizon Financial Group
Nathan Ollish, Financial Advisor - Impel Wealth Management
Grace Hayden MacNaught, Financial Advisor - Atlanta Planning Group
Dusty Green, Financial Advisor - Spencer Financial Inc.