

July 2026 Investylitics

Horizon Advisor Network Investment Committee July 6, 2026
Executive Summary
June was a challenging month for the market as both the S&P 500 and the Nasdaq lost ground. This came amid stronger-than-expected U.S. growth, continuing inflation pressures, and an uncertain geopolitical backdrop in the Middle East.
The U.S.-Iran agreement officially went into effect on June 17, 2026, following its electronic signing by both nations. Although there have been skirmishes since the signing, oil prices have fallen by nearly 20% amid efforts to reopen the Strait of Hormuz.
New Fed chair Kevin Warsh oversaw his first FOMC meeting and press conference. He immediately began leaving his footprint on the institution by creating five committees to review various Fed functions and policies, while also seeking to limit the impact of forward guidance.
As we enter second-quarter earnings season, expectations are for another season of 20%+ earnings growth in the S&P 500. The bar has been set high, and investors and portfolio managers will be closely watching statements and future guidance from companies reporting.
The first half of 2026 has been a case study for why the committee strongly supports disciplined diversification. Asset class performance diverged from expectations at the beginning of the year in many cases, but diversified portfolios have produced good risk-adjusted returns.
The members of the Horizon Advisor Network Investylitics Committee met on the afternoon of Monday, July 6th. It has certainly been an interesting first half of the year with multiple forces pushing and pulling on the markets and the economy. We were happy to have the opportunity to review portfolio performance over the first six months of the year and discuss the mid-year outlooks from the various economists and market strategists our committee follows.
June was a challenging month for the market as both the S&P 500 and the Nasdaq lost ground. In June, U.S. markets experienced a tech sector pullback that weighed on the major averages. The S&P 500 fell by 0.7%, while the tech-heavy Nasdaq Composite declined by 2.7%. Despite the monthly dip, both indexes logged massive gains in the first half of the year, with the S&P 500 up 9.6% and the Nasdaq climbing more than 12%.
We have continued to see a divergence between hard data and soft data in economic reports and surveys. Economic growth continues to come in stronger than expected. GDP is projected to be approximately 2.5% in the second quarter, both the manufacturing and service sectors are expanding, and the AI data center build-out continues at a record pace.
However, as you can see in our first chart below, consumer sentiment has continued to disconnect from both economic data and stock market performance. You will note that from 2014 until the COVID-19 lockdowns in 2020, consumer sentiment and the S&P 500 were much more closely correlated. This relationship broke down post-pandemic, and the gap has continued to widen despite a constructive economic backdrop.
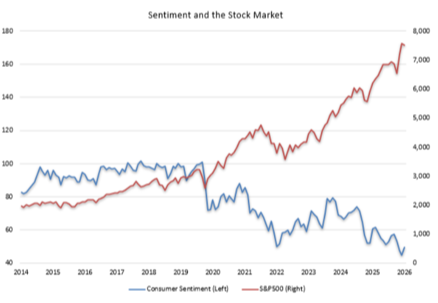
Source: JP Morgan Chase
However, as has typically been the case over the last five years, how people say they feel is often not correlated with what they do. Despite record-low levels of sentiment and confidence, consumers continue to spend at record levels, as shown in our second chart below.
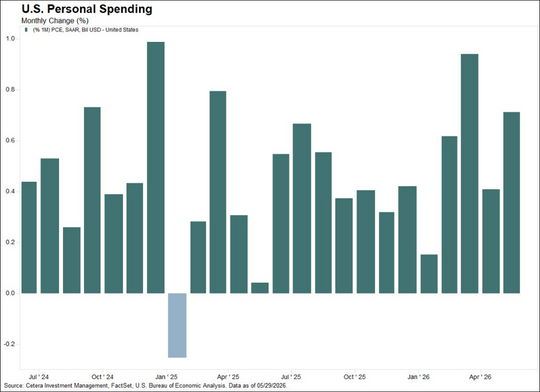
US personal spending rose 0.7% in May, exceeding expectations of 0.6% and accelerating from April’s 0.5% pace. Spending was supported by a 0.7% rise in personal income, outpacing the 0.4% rise in the PCE price index.
The U.S.-Iran agreement officially went into effect on June 17, 2026, following its electronic signing by both nations. Although there have been skirmishes since the signing, oil prices have fallen by nearly 20% amid efforts to reopen the Strait of Hormuz. The committee believes that lower oil and gasoline prices should help reduce future inflation measures and put more money in consumers' pockets during the later months of summer, as we head toward this fall's midterm elections. Of course, additional geo political uncertainty could change this at any point.
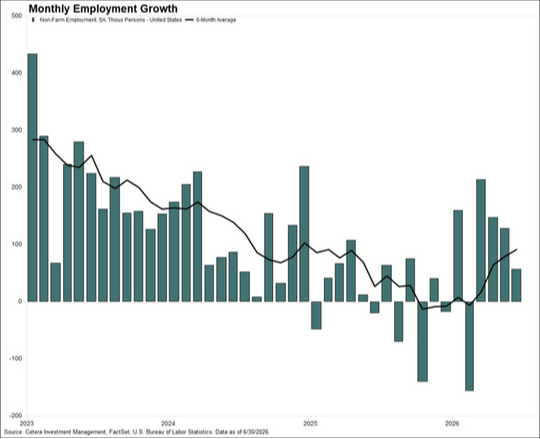
After several months of job growth exceeding expectations, the unemployment report released on Thursday, July 3rd, ahead of our nation's 250th birthday, showed more moderate gains of just 57,000 new jobs. As you will note in the chart below, the six-month average for job growth has continued to rebound from the lows that were reached last fall and winter. We believe that slower job growth may allow the Federal Reserve Bank to look through short-term inflation pressures driven by oil prices and the war in the Middle East, and to keep interest rates steady for the next several months.
To that end, new Fed chair Kevin Warsh oversaw his first FOMC meeting and press conference. He immediately began leaving his footprint on the institution by creating five committees to review various Fed functions and policies, while also seeking to limit the impact of forward guidance. Chairman Warsh has stated that he would like to see market forces rather than the Fed set prices and expectations in the economy.
As we enter second-quarter earnings season, expectations are for another season of 20%+ earnings growth in the S&P 500. The bar has been set high, and investors and portfolio managers will be closely watching statements and future guidance from companies reporting.
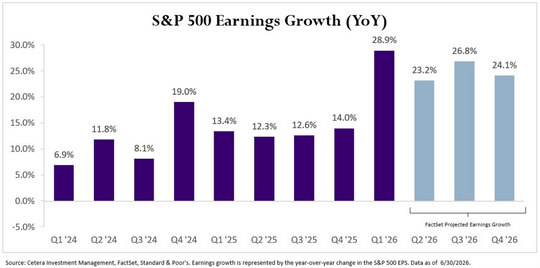
The S&P 500 has posted double-digit earnings growth for 6 straight quarters, including 28.9% growth in Q1. FactSet projects 20%+ earnings growth for the rest of the year, which supports the market, but raises the hurdle for upside surprises. The committee will continue monitoring this closely over the coming weeks.
Finally, the first half of 2026 has been a case study for why the committee continues to strongly advocate for disciplined diversification. Asset class performance diverged from expectations at the beginning of the year in many cases.
For example, as the new year began, most economists expected the Fed to cut interest rates twice. Since bond prices rise as interest rates fall, most strategists felt the bond market was poised to deliver strong returns this year.
However, when war broke out in the Middle East and oil prices rose, inflation also increased. This caused interest rates to rise and led many to believe that the Fed may actually have to raise rates rather than lower them. This has produced much more moderate returns than most expected from the bond market year to date.
However, diversified portfolios have produced good risk-adjusted returns. Because no one on the committee or reading this newsletter can accurately predict geopolitical events or how markets will respond, a well-designed portfolio tailored to your unique financial goals remains our recommended strategy.
As always, should you have any questions regarding your family's unique situation, please do not hesitate to reach out to your advisor. The Investylitics Committee members appreciate your continued trust and support in our team and our process. Make it a great day!