
May 2026 Investylitics

Horizon Advisor Network Investment Committee May 11, 2026
Executive Summary
The markets and many economic indicators have diverged from consumer sentiment, which is largely being dragged down by higher costs, especially gasoline prices. Oil prices continue to fluctuate daily in response to headlines and perceptions of how long the conflict in the Middle East will last.
The Citi Economic Surprise Index for the United States is currently reading 36.40 as of May 11th, indicating that actual economic data releases have been consistently beating market expectations.
The Federal Reserve Bank appears to be stuck between its dual mandates of price stability and full employment, as higher oil prices are feeding through inflation numbers on both the consumer and producer levels. This leaves our new Federal Reserve Bank Chairman, Kevin Warsh, in a difficult position.
According to our friends at FactSet, first-quarter earnings continue to come in much stronger than expected. So far, corporate earnings are up 27.7% on a year-over-year basis compared with an estimate of 13.1% on March 31st.
The committee strongly recommends maintaining your strategic asset allocation, which has been structured to help you reach your long-term financial planning goals. With markets near all-time highs, we recommend regular rebalancing and creating cash for short-term liquidity needs, and we strongly advise NOT reacting to day-to-day headline news.
The members of the Horizon Advisor Network Investylitics Committee met on the afternoon of Monday, May 11th. Amid ongoing geopolitical and economic headlines, we focused on the research and outlooks from the market strategists and economists, followed by the committee. As is typical, there was plenty of data and opinion to parse through.
The markets and many economic indicators have diverged from consumer sentiment, which is largely being dragged down by higher costs, especially gasoline prices, which have risen to their highest levels since 2022, when Russia first invaded Ukraine, as you can see in our first chart below.
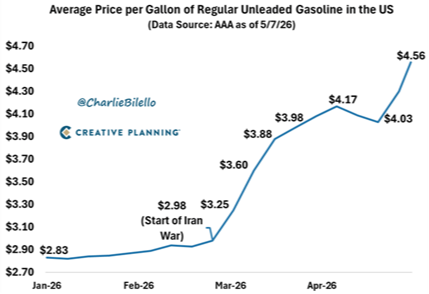
source: creative planning
Oil prices continue to fluctuate daily in response to headlines and perceptions of how long the conflict in the Middle East will last. Against this backdrop, nonfarm payrolls, retail sales, manufacturing, and service-sector activity have all surprised to the upside over the last month, indicating a resilient U.S. economy. Unfortunately, this has also been accompanied by rising inflation readings at both the producer and consumer levels.
As of May 11, 2026, the Citi Economic Surprise Index for the United States stands at 36.40. This positive reading indicates that overall economic data releases have continued to outperform market expectations. The index has remained positive since January 2025, marking 14 straight months of data outperforming forecasts. This extended positive streak is the longest since the 2008-09 financial crisis, driven by stronger-than-expected exports and industrial data, which have led to upward revisions to economic growth forecasts. A positive index suggests that analysts and economists have been too pessimistic in their forecasts.
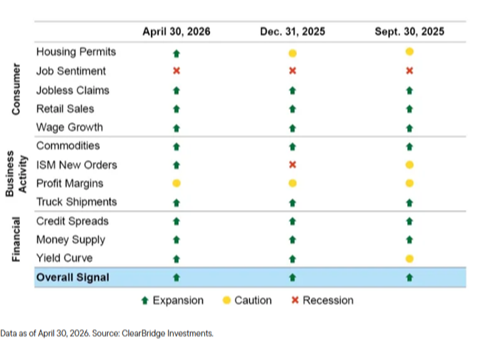
Altogether, this has led to additional upgrades in both housing permits and ISM new orders on ClearBridge’s US Recession Dashboard below. As you can see, 10 of the 12 consumer, business activity, and financial indicators they use to signal future recession risk are now showing green arrows, which may surprise some of our clients, given the recent negative consumer and job sentiment readings.
The Federal Reserve Bank appears to be stuck between its dual mandates of price stability and full employment, as higher oil prices are feeding through inflation numbers on both the consumer and producer levels. The cumulative effects of post-COVID stimulus, Russia's invasion of Ukraine, trade/tariff uncertainty, and the recent conflict in the Middle East have pushed inflation to its highest level in decades, as shown in the chart below.
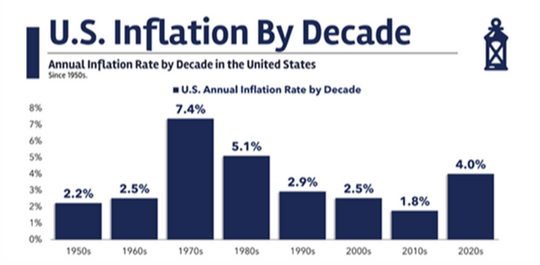
Source: A Wealth of Common Sense – “Inflation is not going back.”
This leaves our recently confirmed new Federal Reserve Bank Chairman, Kevin Warsh, in a difficult position. Based on his previous congressional testimony, speeches, and writings, he believes the Fed should lower interest rates in response to challenges in the employment market and to enhanced productivity resulting from AI investments and enhancements. However, the rebound in inflation data will likely keep the Fed on hold in the near term. They may, however, look to reduce the size and composition of their balance sheet in the coming months, which has ballooned from approximately $800B, prior to the 2008 Great Financial Crisis, to nearly $7T today. The committee members will keep a close eye on this transition.
According to our friends at FactSet, first-quarter earnings are coming in much stronger than expected. With 89% of S&P 500 companies reporting actual results, 84% of S&P 500 companies have reported a positive earnings surprise, and 80% of S&P 500 companies have reported a positive revenue surprise. For Q1 2026, the blended (year-over-year) earnings growth rate for the S&P 500 is 27.7%. This exceeds the March 31st first-quarter estimated earnings growth rate of 13.1% by a wide margin.
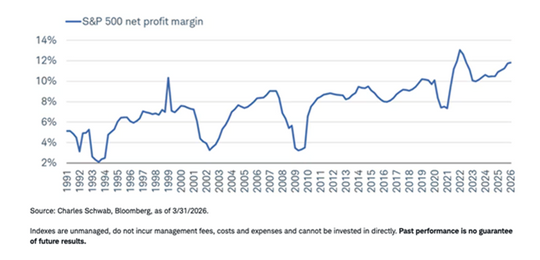
If 27.7% is the actual growth rate for the quarter, it will mark the highest earnings growth rate reported by the index since the fourth quarter of 2021, as we were coming out of the COVID-19 pandemic, which was fueled by massive fiscal and monetary stimulus from the federal government and the Federal Reserve Bank. Additionally, corporate profit margins continue to rise despite higher inflation, tariff uncertainty, and geopolitical risk. This demonstrates that corporate America has been able to navigate this backdrop better than expected.
The committee believes that over the coming months, our clients will likely be inundated with negative news and headlines, which could create market volatility and uncertainty in investor behavior. This could take the form of headlines about oil prices, the war with Iran, markets near all-time highs, and the upcoming midterm elections. Historically, seasonality factors tend to increase volatility during the summer months. You may have heard the term “sell in May, and go away”. We would like to remind you that to participate in the upside of the markets, you need to be appropriately invested and allocated.
Against this mixed backdrop of economic, inflation, and geopolitical news, the committee strongly recommends maintaining your strategic asset allocation, which has been structured to help you reach your long-term financial planning goals. With markets near all-time highs, we recommend regular rebalancing and creating cash for short-term liquidity needs, and we strongly advise NOT reacting to day-to-day headline news.
The committee appreciates your ongoing trust and support. We are closely watching the market and economic indicators. We stand ready to adjust our model portfolios when we deem it appropriate. As always, if you have questions about your unique situation, please reach out to your financial advisor. We are here for you. Thanks, and make it a great day!